
Calgary's housing market cooled again in October 2026: sales fell 15.3% from a year ago, while prices held close to flat.
According to CREB®'s October statistics, 1,592 homes sold across the city, down from 1,879 in October 2025. The benchmark price for a typical Calgary home was $564,200, just 0.35% below last year. New listings also pulled back, and the number of homes for sale dropped to 6,173 from 6,486 in September. Here is what that means as we move into winter.
October by the numbers
Sales slowed faster than listings, so homes are taking up a bit more room on the market relative to demand.
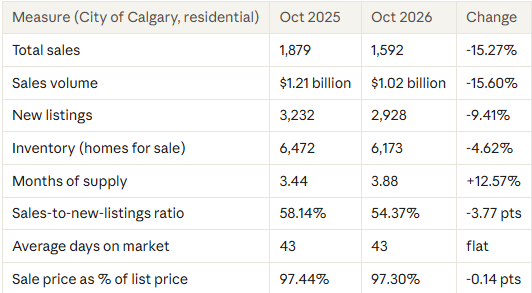
Inventory is easing, down from a June 2026 high of 6,803 homes to 6,173 now. But because sales are falling faster than inventory, months of supply rose to 3.88 from 3.44 a year ago. A sales-to-new-listings ratio in the mid-50s generally points to a market that is balanced rather than strongly favouring buyers or sellers.
Sales are also down about 27% from the June 2026 peak of 2,193, though some of that is the normal seasonal slowdown. Year to date, 17,878 homes have sold, 10.94% fewer than at this point in 2025, and new listings are down 9.64% to 33,657.
Prices: flat year over year, drifting lower since summer
The citywide benchmark price was $564,200 in October, down 0.35% from a year ago and 0.44% from September's $566,700. It has slipped about 1.5% since peaking at $572,500 in June.
Other measures moved a little more. The median price was $562,500, down 2.51% from last October, while the average price was $640,769, down 0.39%. The benchmark tracks a typical home of fixed characteristics, so it is the steadier read. Median and average prices also shift with the mix of homes that sell in a given month.
Over the first ten months of 2026, the benchmark price has averaged $565,680, 2.72% below the same period in 2025.
By property type: semi-detached holds up, apartments lag

Detached homes made up more than half of October's sales. Prices there are down less than 1% from a year ago, and 3.34 months of supply is on the tighter side. Semi-detached homes were the standout: sales were nearly unchanged and the benchmark price rose 0.78%, the only property type with a year-over-year gain.
The softer spots are row homes and apartments. Apartment sales fell 22.33% from last October and are down 24.52% year to date, leaving 5.28 months of supply and homes sitting an average of 55 days. Row-home inventory is slightly above last year (up 1.33%), and its benchmark price is down 5.12%.
Across the city: the west and centre are firm, the northeast and east are soft
The split between districts is clearest in detached homes.
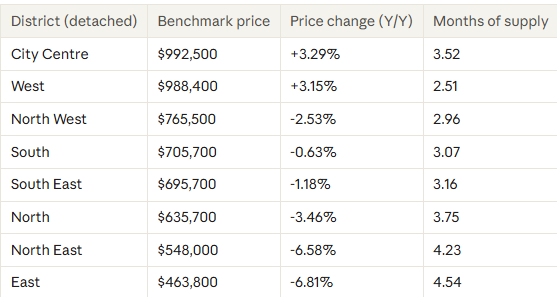
City Centre and the West were the only districts where detached prices rose year over year, and the West has the tightest supply in the city at 2.51 months. At the other end, detached prices in the North East and East are down more than 6%, with 4.2 to 4.5 months of supply.
Apartments show a similar pattern. The North and North East have the most inventory relative to sales, at 9.47 and 8.60 months of supply, while the City Centre accounts for the most apartment sales (140 of the city's 320).
What it means for buyers and sellers
If you're buying: Homes sold for an average of 97.30% of list price in October, so there is room to negotiate. You will find the most leverage in apartments, row homes, and the North East and East districts, where supply is higher and prices have softened. Detached homes in the West and City Centre remain the most competitive.
If you're selling: The typical home took 43 days to sell, and apartments took 55. Pricing close to the market from the start matters more than it did a year ago, since buyers have more time to compare. Semi-detached and well-located detached homes are holding value best.
Every home and street is different, and these are citywide and district averages. Contact us for a valuation or a buyer consultation based on your specific neighbourhood and property type.
Looking ahead
Calgary enters winter with fewer listings, slower sales and prices that have eased only slightly. Supply is coming down from its summer high, but demand is slowing at a similar pace, so conditions look balanced rather than tilted sharply toward either side. We'll be watching whether sales stabilize as listings thin out over the winter months.
Sources: CREB® Calgary Monthly Stats Package, October 2026 and CREB® Regional Monthly Stats Package, October 2026. All figures are City of Calgary residential unless noted, and year-over-year changes compare October 2026 with October 2025.
Ready to Navigate This Market With Confidence?
Whether you're buying, selling, or just trying to understand what these numbers mean for your specific neighbourhood, I'm here to help you cut through the noise and make your best move.
Looking for community info, market stats & schools:
Looking for a particular lifestyle:
Other Blogs:
Calgary's Best Hidden Gem Neighbourhoods in 2026 | Local's Guide to Underrated Communities
Moving to Calgary? 16 Things You Should Know Before You Arrive
Top 10 Calgary Communities for a “Car-Light” Lifestyle Outside the Core
Buying a Home in Calgary: Your Most Common Questions Answered
Finished Basement vs. Unfinished Basement: Which One is Right for You?
Comments:
Post Your Comment: